[sws_button class=”” size=”sws_btn_small” align=”sws_btn_align_left” href=”http://tristantech.com/wp-content/uploads/2013/10/PVP-MFP.pdf” target=”_blank” label=”Download the PDF” template=”sws_btn_midnightblue” textcolor=”000000″ fontweight=”normal” bgcolor=”” bgcolorhover=”” glow=”sws_btn_glow” btnwidth=”” textalign=”center”] [/sws_button]
[sws_divider_small_padding]
This is a step–by–step tutorial on how to find noise sources. It is not intended to be the final answer, but hopefully most possible noise sources will be mentioned and will provide the clues to obtaining a sufficiently low noise system. This also assumes that you are having some type of difficulty with your measurement and need to do a careful analysis of what is going wrong. You may wish to read this even if you are just starting out to see what type of problems can arise.
As trouble shooting equipment, you should have, at a minimum, a volt meter capable of resolving 1 mVDC and 10 mVAC. In addition, a general purpose, triggered sweep oscilloscope is also recommended. A preamplifier can be useful if the oscilloscope is not very sensitive. It may also be able to provide low pass filtering which is useful in reducing some noise sources. If a low frequency (DC to 200 kHz) spectrum analyzer is available, it is ideal for identifying noise sources.
To refresh your memory, some of the specifications of the model PMS Picovolt Measurement System are:
-
- Voltage Gain : 1.00 x 10⁸ (±2%)
- Noise:

- Bandwidth at MFP Probe output: DC – 3 Hz
- Slew Rate: not to exceed 50 nV/second for reversible operation
- Maximum signal at Standard Resistor: 100 nV (for reversible operation)
- Current Leads: rf decoupled floating pair, maximum current 0.5 Amperes
We assume that you are trying either to measure voltages on the order of picovolts (10-12 V) or resistances less than a nanoOhm (10-9 Ω). Resistances can be determined by measuring the voltage drop across the unknown resistor due to an applied current. There may be some noise source that is masking the signal of interest. Let us consider that you are trying to make a resistance measurement using the circuit shown below. The Picovolt system is used in an external feedback mode, hence the feedback resistors RF and Rstd which are built into the MFP probe. The external feedback creates a current through Rstd to equal the voltage drop across Runknown. See the MFP probe manual for details.
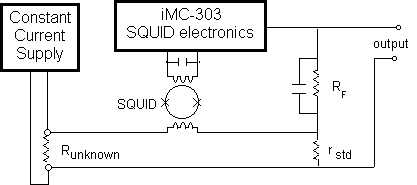
Assume that Runknown has a resistance on the order of a nanoOhm (10-9 Ω). Since the typical noise level of the model PMS is ~ 10-13 Volts/√Hz, a resistance of 10-10 Ω would require a current of 10-13 Volts/10-10 Ω = 1 mA for a signal/noise ratio of one. 10 mA would be a more likely current in order to actually see a change in the SQUID control output when changing the current.
Now that we know you are having problems, let’s go back to the beginning. We need to identify whether the interfering noise source is radio frequency (RFI) or audio frequency (including 50 or 60 Hz power line) in nature.
Step one: Remove all experimental attachments to the model MFP probe and short the inputs (with a superconducting wire placed below the brass washers as shown below).
If you are immersing the probe directly in liquid helium, you may need to wait five minutes for the SQUID and terminal board to come into thermal equilibrium (at 4.2 K). Now measure the system noise with the voltmeter, or spectrum analyzer if available. The noise should be less than 10 mV peak–to–peak on the x1 range (100 mV on x10 and 1 V on x100). You may be seeing a value much greater than 10 mV. Please remember that the SQUID transfer function is multi–valued and you may need to reset the control electronics. Whatever DC value you are observing should remain stable. If not, carefully re–read the manual and try again. If you are having problems at this point, you should call the customer service department.
If you suspect (50/60 Hz) power line interference, connect the output of the model iMC-303 to an oscilloscope set to an appropriate timebase and sensitivity (1 mVolt/div or better). At a scope timebase of 2 – 10 msec/div you should be able resolve 50/60 Hz if it is present. A preamplifier may be helpful if your oscilloscope is not sufficiently sensitive. Be sure that the model iMC-303 and the preamp filter settings, if any, are wider than 50/60 Hz. Please note that the model iMC-303 output may give inaccurate readings due to potential ground currents and thermal EMFs between the model iMC-303 and the MFP probe. Use of a preamp/filter between the MFP probe voltage output and the oscilloscope will avoid this problem.
Step two [INTERNAL FEEDBACK] (assuming that step one seems OK).
The MFP probe terminal should look like this:
You will want to hook up your current source to pins A and B of the auxiliary inputs found on the MFP probe. Please note that this circuit is not designed to handle large ampere currents (0.5 A maximum). If you intend to use large (1 – 200 A) currents, initially try a low amplitude current source to give a feeling for how a low noise current supply should behave.
Again, monitor the output noise from the model iMC-303. Should the noise be excessive, the current supply is the most likely source. Check for the presence of 50/60 Hz (as described in step one). If 50/60 Hz is present, you will need to filter the inputs carefully. If the 50/60 Hz is not too large, use of a notch filter in combination with the 5 Hz filter of the model iMC-303 should suffice to reduce this to an acceptable level.
Let us assume you are using your own current source. The R1, R2 network is to reduce the current that goes through the SQUID sensor. Large currents through the SQUID sensor can trap flux in the sensor (requiring the sensor to be warmed up above 10 Kelvin) or possibly damage the SQUID. What we are interested in here is to see what type of noise sources are being coupled into the SQUID system. Now repeat the same noise analysis described in step two. If OK, go onto step three. If not, then try to determine where the noise source is.
If Steps one and two were OK and you are having problems in step 2.5, then it is a pretty good guess that your current leads or current supply is the problem. To check the current leads, hook up the model CCS to the room temperature input. If there is no change, then your leads could be the problem. If the noise “goes away”, then your power supply may be at fault. If 50/60 Hz is the major offender, you may wish to put some sort of low pass filter at the input of the leads to remove 50/60 Hz contributions.
Step three: Place an “unknown” resistor of ≈ 1 mW (2 cm of 0.1 cm (0.040″) diameter brass wire or 0.2 cm of 0.040″ diameter manganin (using copper wire will give mW resistances) in the arrangement (shown on the next page) (such a ‘large’ resistance is chosen to let you easily see the effect of a non–zero Rx—once you get a feeling for mA current changes through mW resistances, then you can reduce Rx with some confidence that you know what is going on).
Hook the voltmeter to the voltage output of the MFP probe. Using the current source, note that a current change of 10 mA will give a change in dc voltage of » 1 volt. Using the chart recorder, you should be able to generate step (or saw tooth) functions by changing the current. Note that the maximum rate (slew rate) that you can change the current is one that would give you a voltage drop of 50 nV/sec across Rx. For the ~ 1 mW resistor, this would be equivalent to 50 mA/sec. If you have noise sources that are slewing faster than 50 mA/sec (for a 1 mW resistor), the system will lose lock and you will need to hunt down and eliminate those noise sources. Even if the noise does not exceed the slew rate of the model iMC-303 electronics, the sum of the slew rate of the noise sources and the ramp rate of your current supply may exceed the equivalent of 50 nV/sec. In this case you will need to reduce your maximum ramp rate.
Provided that the system can maintain “lock”, it may be possible to operate the system in the presence of significant noise. For example, using a standard Picovolt Measurement System setup as described, but with a superconducting wire replacing the unknown impedance, you might observe a 50/60 Hz component to the noise of say 40 picovolts peak–to–peak. In terms of RMS noise this is 140 times the expected system noise (0.1 picovolt/Ö Hz). If you hook up your voltmeter (or chart recorder) to the output (BNC) connector on the rear of the model iMC-303 control electronics, you can utilize the model iMC-303 filters to remove high frequency components that contribute to system noise. You will then be able to resolve finer changes in the output voltage of your system.
It is recommended that, if you have been having troubles with resolving picovolt voltages or equivalent resistances, you use a superconducting short to quantify what the actual system noise and resolution is. Then, knowing what your system performance really is, use the actual resistance of interest.
In general, we have found that the major problem with resolving picovolts (and equivalently picoOhms) is that the experimental setup allows either RFI or 50/60 Hz noise to get into the input of the SQUID. As mentioned earlier, if you are using current leads of your own design rather than the current leads internal to the MFP probe, this is a likely spot where you could be introducing noise into the system. A check with the current source will help to spot this.
There may be situations where even 100 mA of noise is sufficient to cause the system to lose lock. In this situation it is preferable to use a lower maximum current. For example, using a piece of superconducting wire (Rx = 0), setting the range of the current supply to 100 mA may give rise to excessive noise, whereas reducing the supply to 50 mA maximum will allow ‘measurements’ to be made. In this case, the noise contributions are due to the current supply (on the 100 mA range).
Commercially available current sources (e.g., Hewlett–Packard 6260B) may have relatively large amounts of noise and ripple (especially those designed to put out 100 A or more). If you suspect that your power supply may be introducing noise, you may want to check the current ripple and noise by measuring the voltage drop across a resistor (e.g., a Dale 1W, 250 W resistor). As mentioned before, you may be able to reduce these contributions by filtering. Contact the current source manufacturer for instructions on how to appropriately filter their supply.
An alternative approach is to use 12V car batteries in parallel to provide large, relatively noise free, current sources. The use of battery supplies will avoid coupling 50/60 Hz into the system. You will need to have enough battery capacity such that the battery will not be loaded down and the current decrease so much that it causes voltage changes (across Rx) to exceed the system slew rate.
To further reduce RF interference, you may wish to place a small resistive shunt across the input of the SQUID sensor. (Model MFP probes shipped from the factory may have a moderately low impedance (3W) shunt across the input of the SQUID sensor.) A 1W shunt will reduce the (SQUID) frequency response to 80 kHz while raising sensor equivalent noise to 150 mF/Ö Hz. The equivalent numbers for a 1⁄2 W shunt are 40 kHz and 200 mF/Ö Hz. Fortunately, efforts to reduce 50/60 Hz also tend to reduce RFI also.
Even if your power supply is perfect and your leads are well filtered, it may be possible to introduce noise into the system by ground loops or improper grounding of your power supply. How you “dress” your leads, especially if you are in a severe RFI environment, may determine if you are actually creating an antenna for noise. Tightly twisted pairs of wires tend to have low inductances and thus not to act as antennae.
If your dewar is non–metallic (e.g., a G–10 fiberglass dewar such as the Tristan model BMD–6X), audio and RF interference may not be attenuated. Metal dewars can be superior in their rejection of RF noise, but only if the experiment is completely surrounded by metal (i.e., a Faraday cage). Using a metal dewar may not prevent noise from entering into your system if there are openings that are not metallic (e.g., using a rubber stopper to seal an access port or an insulating top plate to the dewar).
The best way to isolate the experiment is to have it completely surrounded with a superconductor. 0.005″ thick lead foil can be used for this purpose. However, remember that it does no good to use a superconducting shield if you are going to pump large quantities of RFI and 50/60 Hz down the experimental leads.
What has been written is by no means a complete description on how to eliminate all noise sources from the model PMS Picovolt Measurement System. It should give you a starting point and allow you to hunt for the noise sources with some degree of confidence.
EXTERNAL FEEDBACK
The standard 330X rf SQUID electronics utilizes an internal feedback technique to cancel changes in magnetic flux. An audio–frequency oscillator provides a reference for a phase–sensitive detector and also modulates the (peak–to–peak) flux linking the SQUID due to the rf coil by an amount Fo/2. The resulting change in flux in the SQUID results in an output from the phase sensitive detector which is fed back to the rf coil. The current fed back to the rf coil counters the flux changes due to the input coil and maintains the flux in the SQUID locked at an extremum in the rf response (triangles). This manner of operation is referred to as a flux–locked loop.
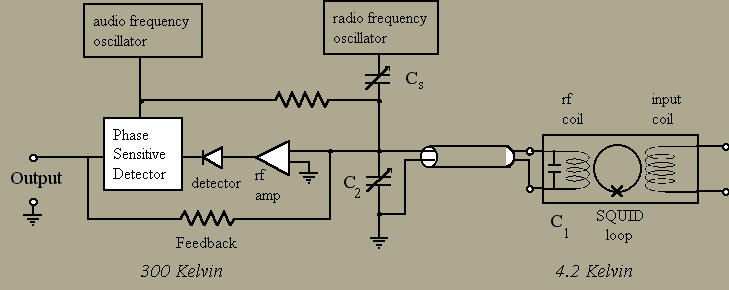
An alternate approach to feedback may be made by coupling the feedback signal to the input coil rather than the rf coil as shown below.
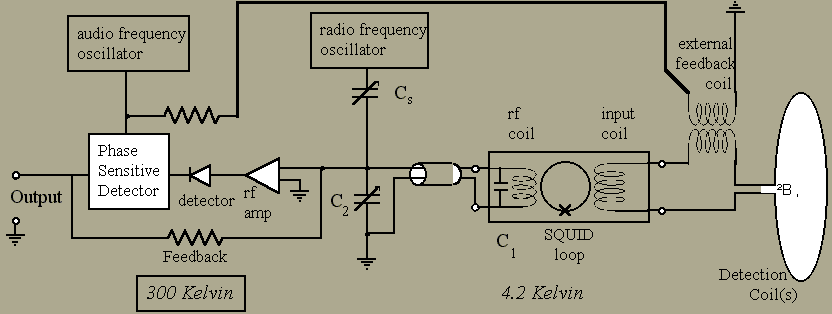
When calculating the sensitivity of the detection coil, remember that the portion of the external feedback coil that is in series with the detection and input coils must be taken in account. For a simple detection coil
DF = N A DB = Linput + Ldetection + Lfeedback +Lleads) DI
Where DF (DB) is the change in flux (field) penetrating the detection coils, N is the number of turns of the detection coils, A is the area of the detection coils, L is the inductance of the appropriate coil and DI is the circulating current generated by the field changes. In general, tightly twisted pairs of 5 mil NbTi wire will have a stray inductance of ~0.3 mH/meter
Using external feedback with the 330X rf SQUID electronics is quite simple. All that need be done is to have the INT FB button released. This disconnects the internal feedback circuitry that goes to the rf coil. The feedback signal is then available at the rear panel EXT FB BNC jack on the model 30 control electronics, as shown in the next figure.
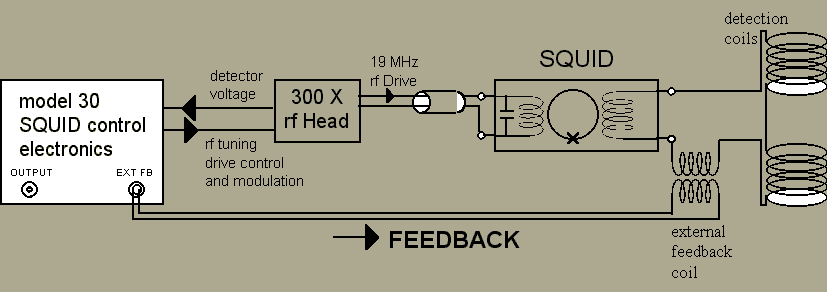
Care must be taken in constructing the external feedback coil and the leads that connect the coil to the model 30 EXT FB BNC jack. The major consideration is to avoid the introduction of potential rf interference into the external feedback coil. Shielding the leads, magnetically isolating the external feedback coil from the signal (or potential noise sources) and proper attention to grounding will reduce the chances of problems.
MAGNETIC SUSCEPTIBILITY
The SQUID can also be used as the null detector in an ac bridge circuit (Fig. 13) to measure both resistive and reactive components of a complex impedance. The unknown impedance Z is excited by a current generated by an oscillator voltage which is attenuated by a precision ratio transformer (l). The difference between the voltage developed across the unknown impedance Z and that developed in the secondary of a nulling mutual inductor m is applied to the input of the SQUID circuit. The primary current in m is proportional to the oscillator voltage and defined by the setting of the ratio transformer (a). An additional reactive current is supplied by a second ratio transformer (b) which causes the primary current to be passed through a capacitor rather than a resistor thus generating a 90° phase shift in the voltage applied to m. The amplified off–balance signal which appears at the output of the SQUID control electronics can be displayed by means of a lock–in amplifier tuned to the oscillator frequency.
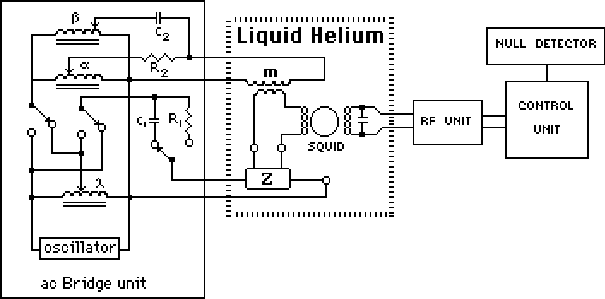
Fig. 13. Block diagram of ac bridge
ac susceptibility measurements require two coils, one for exciting the sample and a second for detection of the induced magnetization. The excitation coil, because it is driven by a constant current oscillator, need not be superconducting (although nothing prohibits the use of a superconductor for winding this coil). The detection coils are connected to the terminal board of the MFP SQUID probe and (if true dc response is of interest) should be superconducting.
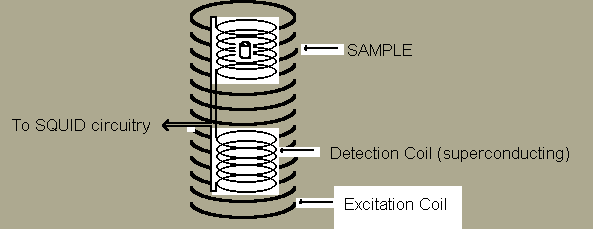
Fig. 2 ac Susceptibility Detection Coils and Sample
For suppression of background noise, improved immunity to drift, rejection of instabilities in the field created by the excitation coil and rejection of the excitation field itself, it is best to wind the detection coil in a gradiometer configuration. The configuration shown is that of a first derivative. We have found that for small samples, a second derivative gradient coil will give further improvement.
Which ever configuration you choose, you will want to wind the (upper or lower) coils to give a uniform response (to the degree desired) over a sufficiently large region to properly characterize your intended sample. A long solenoid is one possibility for winding the portions of the detection coils. Another is winding the opposing sections in a Helmholtz configuration as shown in figure 3.
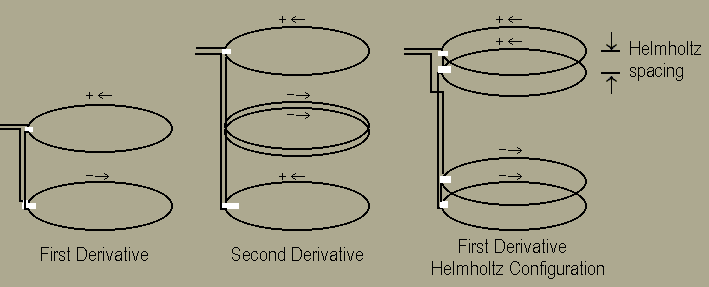
Fig. 3 Possible Detection Coil Configurations
Once you have decided on the coil configuration you plan on using, you need to consider over what temperatures and magnetic fields you want to measure the sample(s). The Helmholtz configuration can be configured (by adding a radio frequency excitation coil) to perform SQUID NMR measurements. Figure 4 shows a first derivative Helmholtz configuration that uses a superconducting shield to stabilize external magnetic field variations. The shield is constructed from NbTi and can shield gauss to tens of gauss external field changes in fields as high as 9 Tesla.
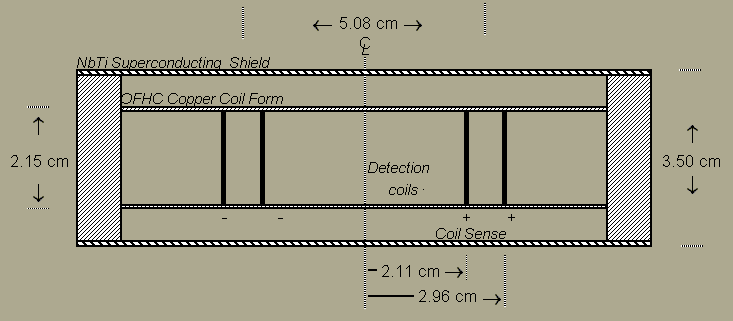
figure 4
The sensitivity of a single loop of wire is equal to the magnetic flux (F) that penetrates the loop divided by the area (A) of the loop. The magnetic flux linking a loop of radius r at a distance z from a current source or magnetic dipole of strength mz is given£1 by
F = mo Mz r2/ 2 (z2 + r2) 3/2
where mo is the permittivity of free space (1.26 x 10⁻⁶ henry/meter). Figure 5 shows the individual response of the coils and the effective response of each pair. As can be see, there are regions where the response to a point (magnetic) source is uniform. For the coil design shown, these regions can be uniform to within 1% over a 7.5 mm right circular cylindrical volume.
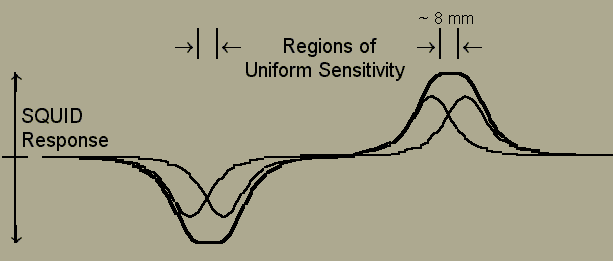
figure 5
The inductance of the detection coil can be calculated according to the formula found in Grover. If we assume two turns/coil and use 5 mil (0.13 mm) NbTi wire, we find that the Ldetection = 1.10 mH. Because the coils are surrounded by a superconducting shield, we need to take into account the effect of the superconducting shield.

The system roll–off can be determined from w = 2pf = R/L =700 mW /0.7 mH Þ f = 159 Hz don’t use (only w/ resistive shunt)
MFP probe wiring diagram for susceptibility measurements
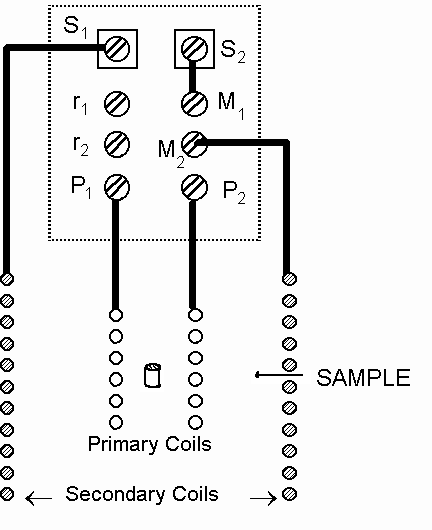
Magnetic Susceptibility as a Thermometer
Another experimental configuration is using the 1/T Curie law susceptibility of the paramagnetic salt cerous magnesium nitrate hydrate, Ce2Mg3(NO3) 12.24 H2O, (CMN) to create an accurate high resolution thermometer. Such thermometers have been used from 6K down to below 5 mK.
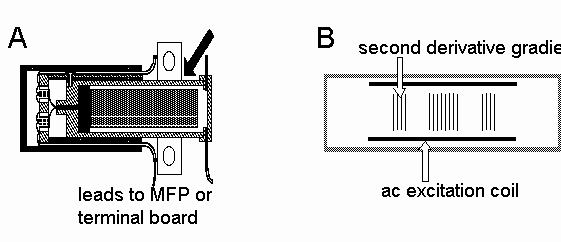
Figure -A shows an external thermometer package which is designed to be firmly attached to the item whose temperature is to be measured: it has a capillary tube (which is connected into the dilution refrigerator plumbing with a simple soft solder joint) for admitting liquid helium, which provides thermal contact between the CMN and the thermometer housing. In both cases a 10 mg CMN powder pill is located in an epoxy form on which are wound two coils, a primary excitation coil and secondary pick–up coil. The susceptibility of the CMN is then monitored by measuring the mutual inductance between the coils using the model RBU bridge.
Owing to the secondary coil design (figure -B) and to the careful construction of the coils, the mutual inductance between the primary and secondary coils is quite small. This small value allows more precise measurements of changes in mutual inductance, which reflect changes in the susceptibility and thus the temperature of the CMN. The secondary coil is designed to give optimum sensitivity when used with the RBU bridge.
A niobium shield surrounds the CMN and coils. This shield, a superconductor below 9K, maintains a constant dc magnetic field on the CMN and also shields the coils from environmental magnetic noise. The secondary coils also have a gradiometer design to additionally assist in eliminating magnetic noise from the system.

